Chemical space is a concept in cheminformatics referring to the property space spanned by all possible molecules and chemical compounds adhering to a given set of construction principles and boundary conditions
Chemical space is the space spanned by all possible molecules and chemical compounds C that is, all stoichiometric combinations of electrons and atomic nuclei, in all possible topology isomers. Chemical reactions allow us to move in chemical space. The mapping between chemical space and molecular properties is often not unique, meaning that there can be multiple molecules which exhibit the same properties. Material design and drug discovery both involve the exploration of chemical space.
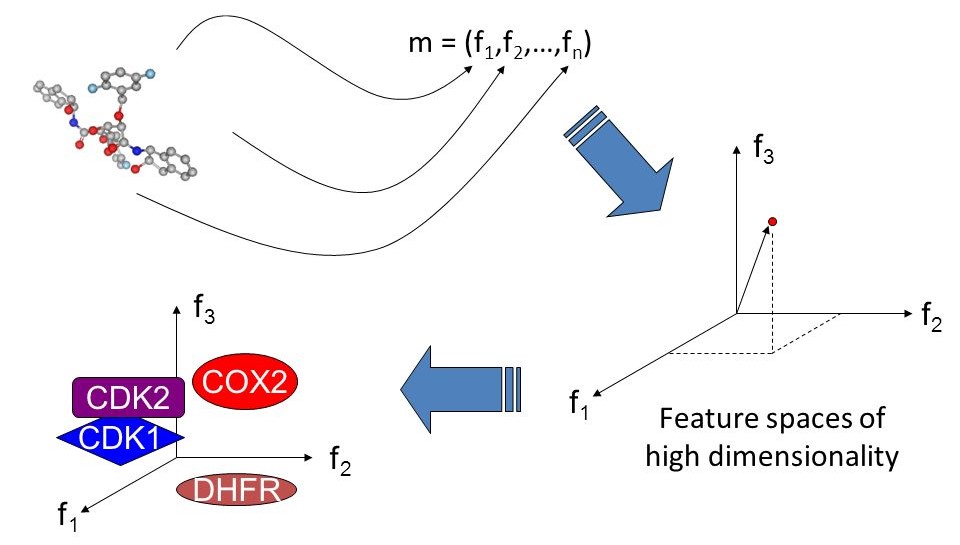
Chemicals can be characterized by a wide range of descriptors , such as their molecular mass, lipophilicity (their affinity for a lipid environment) and topological features. Chemical space is a term often used in place of multi-dimensional descriptor space : it is a region defined by a particular choice of descriptors and the limits placed on them.
There have been several analyses of the chemical space covered by drug molecules, chemical libraries and natural products. Two basic methods have been used: the first visualises chemical property space based on physicochemical properties; the second is based on chemical structure.
Systematic exploration of chemical space is possible by creating in silico databases of virtual molecules, which can be visualized by projecting multidimentional property space of molecules in lower dimensions.